

Global Shipbuilding Industry 2025/2026: Top 11 Leading Countries by 2024 Merchant Shipbuilding Output
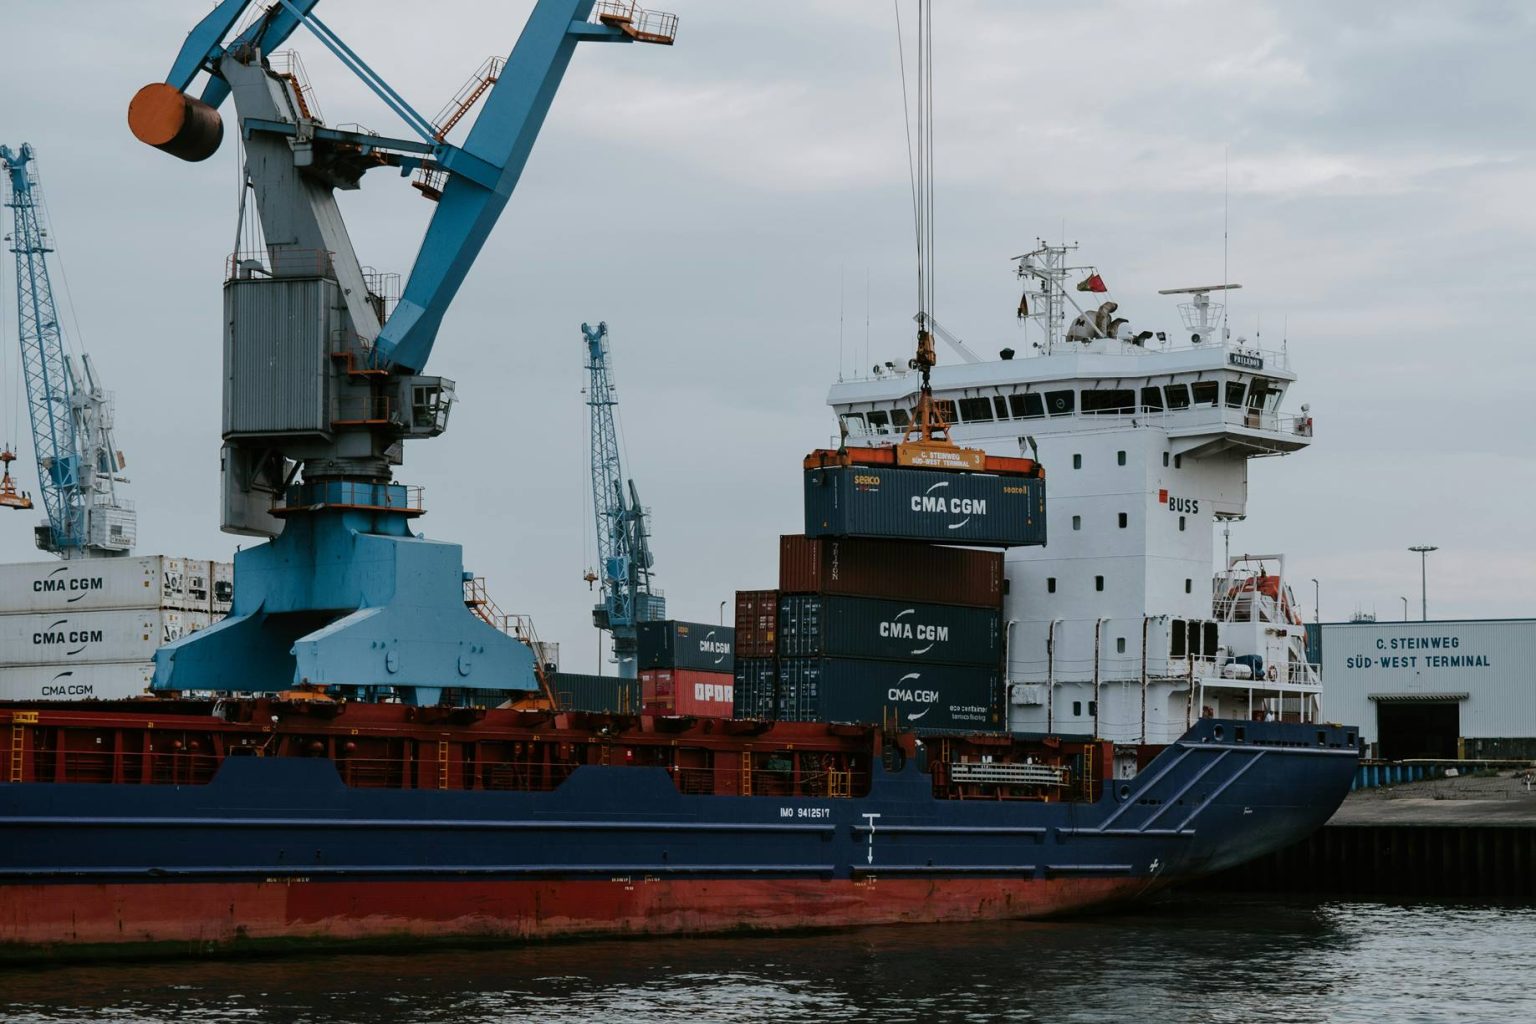
China Led the 2024 Merchant Shipbuilding Delivery Table
China is the largest shipbuilding country by 2024 merchant vessel deliveries, with 54.57% of global merchant shipbuilding output by delivered gross tonnage. The Republic of Korea (South Korea) ranks second with 28.02%, followed by Japan with 12.56%.
The numeric values come from UNCTAD Review of Maritime Transport 2025, Table II.1; Clarksons Research is cited by UNCTAD as the data basis. This is a 2026 industry snapshot using 2024 output values, not a 2026 forecast.
Key result
China ranks first by delivered merchant-vessel gross tonnage, with 54.57% of global output in 2024.
Values are 2024 output shares from UNCTAD Review of Maritime Transport 2025, using Clarksons Research data cited by UNCTAD.
The public UNCTAD table contains 11 country rows, so this page ranks those 11 countries rather than expanding the list with unsupported estimates.
Gross tonnage is not vessel weight, shipbuilding value, compensated gross tonnage, vessel count, orderbook, naval output or ship repair activity.
China’s share of global merchant shipbuilding output by delivered gross tonnage.
Republic of Korea (South Korea) ranks second in the 2024 delivery table.
China, South Korea and Japan together dominate the measured output.
Adding Viet Nam and the Philippines leaves a very small global remainder.
Countries listed in UNCTAD’s leading-country delivery table.
How to Read This Shipbuilding Ranking
What the metric means
The metric measures each country’s share of global merchant vessel gross tonnage delivered by shipyards during 2024. It is a delivery-output measure for commercial shipbuilding.
How to read the rank
Higher percentage share ranks higher. A country with a larger share delivered more merchant-vessel gross tonnage during the measured year.
Important limitations
Gross tonnage is not a measure of ship price, shipbuilding revenue, vessel count, compensated gross tonnage, orderbook, naval construction, ship repair or yard employment.
Why countries differ
Ranking positions reflect yard scale, heavy industrial supply chains, financing, skilled labor, vessel specialization, export demand and long-term industrial policy.
This ranking compares the largest shipbuilding countries by completed merchant-vessel delivery output. Deliveries are not the same as orderbook: deliveries show ships completed during the measured year, while orderbook shows future contracted construction.
Large commercial ocean-going vessels raise gross tonnage output, so countries building bulk carriers, tankers, container ships and gas carriers can rank higher than countries focused on smaller specialized vessels. The table is best read as a delivery-capacity view, not as a full measure of industrial sophistication.
Top 10 Shipbuilding Countries by 2024 Output Share
The top ten show an unusually concentrated industry. China alone accounts for more than half of the measured global delivery output, while China, the Republic of Korea (South Korea) and Japan together account for 95.15%.
Top 10 countries by merchant shipbuilding output share, 2024
| Rank | Entity | Value | Source / method note |
|---|---|---|---|
| 1 | China | 54.57% | UNCTAD Table II.1; 2024 share; delivered merchant gross tonnage. |
| 2 | Republic of Korea (South Korea) | 28.02% | UNCTAD Table II.1; 2024 share; major high-value commercial shipbuilder. |
| 3 | Japan | 12.56% | UNCTAD Table II.1; 2024 share; major commercial builder. |
| 4 | Viet Nam | 1.01% | UNCTAD Table II.1; 2024 share; merchant vessel deliveries. |
| 5 | Philippines | 0.93% | UNCTAD Table II.1; 2024 share; Southeast Asian shipbuilding entry. |
| 6 | Italy | 0.64% | UNCTAD Table II.1; 2024 share; cruise and passenger-vessel context. |
| 7 | Germany | 0.26% | UNCTAD Table II.1; 2024 merchant-output share; naval context excluded. |
| 8 | Türkiye | 0.12% | UNCTAD Table II.1; 2024 merchant-output share; specialized vessels context. |
| 9 | India | 0.06% | UNCTAD Table II.1; 2024 share; delivered gross tonnage only. |
| 10 | United States of America | 0.04% | UNCTAD Table II.1; 2024 merchant-output share; naval output excluded. |
Ranking is calculated from the percentage share in descending order. Display values are not converted into revenue, compensated gross tonnage, ship count or orderbook share.
Main Ranking: All 11 Countries in the UNCTAD Delivery Table
Use the controls to search by country, filter by region, change sorting or switch between the Top 10 and all 11 entries from the source table.
Leading countries by 2024 merchant shipbuilding output share
| Rank | Entity | Value | Source / method note |
|---|---|---|---|
| 1 | China | 54.57% | UNCTAD Table II.1; 2024 share; delivered merchant gross tonnage. |
| 2 | Republic of Korea (South Korea) | 28.02% | UNCTAD Table II.1; 2024 share; high-value commercial shipbuilding context. |
| 3 | Japan | 12.56% | UNCTAD Table II.1; 2024 share; major merchant shipbuilder. |
| 4 | Viet Nam | 1.01% | UNCTAD Table II.1; 2024 share; merchant vessel deliveries. |
| 5 | Philippines | 0.93% | UNCTAD Table II.1; 2024 share; merchant shipbuilding entry. |
| 6 | Italy | 0.64% | UNCTAD Table II.1; 2024 share; cruise and passenger-vessel context. |
| 7 | Germany | 0.26% | UNCTAD Table II.1; 2024 merchant-output share; naval context excluded. |
| 8 | Türkiye | 0.12% | UNCTAD Table II.1; 2024 merchant-output share; specialized vessels context. |
| 9 | India | 0.06% | UNCTAD Table II.1; 2024 share; delivered gross tonnage only. |
| 10 | United States of America | 0.04% | UNCTAD Table II.1; 2024 merchant-output share; naval output excluded. |
| 11 | Norway | 0.04% | UNCTAD Table II.1; 2024 merchant-output share; rounded value. |
Data note: the numeric ranking comes from UNCTAD Table II.1. Clarksons Research is the data source cited by UNCTAD. Context sources below explain the publication series and data environment.
Chart: Output Share for All 11 Countries
The chart uses the same percentage values as the ranking table. China is the 100% visual reference in this chart; every other bar shows that country’s output share relative to China’s 54.57% share, not relative to the whole world.
Methodology
The ranking uses merchant shipbuilding output in 2024, measured as each country’s percentage share of global gross tonnage delivered. Values are taken from UNCTAD Review of Maritime Transport 2025, Table II.1, where UNCTAD cites Clarksons Research as the data basis.
Metric and unit
Metric: merchant shipbuilding output by country. Unit: percent of global gross tonnage delivered in 2024. The unit is a size-based output measure, not a value measure.
Rank direction
Countries are sorted from highest to lowest percentage share. Larger delivered gross tonnage share ranks higher. Equal displayed values keep the table order.
Coverage and exclusions
The ranking includes the 11 countries shown in UNCTAD’s leading-country table. Countries not listed in that table are excluded rather than estimated.
Source hierarchy
Numeric source: UNCTAD Review of Maritime Transport 2025, Table II.1. Data source cited by UNCTAD: Clarksons Research. UNCTADstat and the publication series are context sources.
Missing values and conflicts
No missing rows are filled, and no alternative media or commercial lists are blended into the table. The ranking follows the UNCTAD table values only.
Rounding and calculations
Top-three share is China 54.57 + South Korea 28.02 + Japan 12.56 = 95.15%. Top-five share is 97.09%. Countries after the top three sum to 3.10%.
This page does not create synthetic 2025 or 2026 shipbuilding values. The 2026 label describes the page snapshot and publication context, while the ranked values remain 2024 output figures from UNCTAD’s 2025 review.
The metric does not measure compensated gross tonnage, deadweight tonnage, orderbook, new orders, vessel count, shipyard revenue, ship prices, naval production, repair yards, maritime equipment production, emissions performance, technological sophistication or employment. A country can rank low by merchant gross tonnage while still building expensive, specialized or strategically important ships.
Insights from the 2024 Shipbuilding Output Ranking
Key insight
The top three countries account for 95.15% of the measured global delivery output. This makes shipbuilding by delivered gross tonnage highly concentrated.
China and South Korea gap
China’s 54.57% share is about 1.95 times South Korea’s 28.02% share. The gap reflects China’s very large yard scale in commercial vessel deliveries.
Top five concentration
China, South Korea, Japan, Viet Nam and the Philippines together account for 97.09% of the table’s global output share.
Long-tail pattern
All countries after the top three sum to 3.10%. Smaller shares should be read carefully because the metric captures delivered merchant gross tonnage only.
What This Ranking Means for the Shipbuilding Industry
The ranking is useful for understanding where large commercial vessels are physically delivered. It shows that merchant shipbuilding capacity is heavily concentrated in a small group of countries, especially China, the Republic of Korea (South Korea) and Japan.
It should not be read as a complete measure of industrial sophistication. South Korea’s position is closely linked to high-value commercial vessel segments, Italy’s role is connected to cruise and passenger vessels, and the United States is far more important in naval and defense shipbuilding than its merchant gross-tonnage share suggests.
For supply-chain readers, the main takeaway is delivery-capacity concentration. A shock affecting East Asian shipyards, steel supply, marine engines, ship finance, export controls or marine equipment supply chains could influence global newbuilding schedules. For policy readers, the table explains why shipbuilding remains a strategic industry even in countries with small current merchant-output shares.
Download the Global Shipbuilding Industry 2025/2026: Top 11 Leading Countries by 2024 Merchant Shipbuilding Output dataset
Global Shipbuilding Industry 2025/2026: Top 11 Leading Countries by 2024 Merchant Shipbuilding Output
11 ranked entries · Excel + CSV + methodology + sources + chart · Snapshot: 2024 · Version 1.0
The archive includes machine-readable data, methodology and source documentation. Quick human verification is required before the ZIP is delivered. Full Data Pack downloads require a free account. Free accounts can download 1 different Data Pack every 30 days; re-downloading the same pack does not use another slot. Annual Data Access provides unlimited manual downloads while annual access is active.
Download Excel + CSV Data PackFAQ
Which country leads the global shipbuilding industry by delivered merchant gross tonnage?
China leads this ranking, with 54.57% of global merchant shipbuilding output by delivered gross tonnage in 2024.
Is South Korea included in the ranking?
Yes. The UNCTAD table lists the Republic of Korea, also commonly searched as South Korea. It ranks second with 28.02% of global merchant shipbuilding output by delivered gross tonnage.
Are these 2026 shipbuilding values?
No. This is a 2026 page snapshot using 2024 output values from UNCTAD Review of Maritime Transport 2025. The page does not estimate 2026 deliveries.
Why is this not a Top 100 ranking?
The public UNCTAD leading-country table contains 11 country rows. Expanding the ranking to 100 countries would require unsupported estimates or another verified data source.
What does gross tonnage output measure?
It measures the share of global merchant vessel gross tonnage delivered by shipyards in each country during the year. It is a size-based output measure for merchant shipbuilding.
Is gross tonnage the same as vessel weight or value?
No. Gross tonnage is not vessel weight, ship price, shipyard revenue, compensated gross tonnage or vessel count. It captures a size-based aspect of delivered merchant vessels.
Does this ranking include naval shipbuilding?
No. The ranking is based on merchant shipbuilding output. Naval and defense shipbuilding are mentioned only as context where they affect interpretation of a country’s broader shipbuilding role.
Why can a low-share country still matter?
A country can have a small merchant gross-tonnage share and still matter in naval shipbuilding, cruise ships, specialized vessels, marine equipment, repair yards, high-value engineering or future orderbook development.
Sources
UNCTAD Review of Maritime Transport 2025
Primary numeric source for Table II.1, “Overview of leading global shipbuilding countries,” including 2024 output shares and country-specific notes. UNCTAD states that its calculations are based on Clarksons Research.
https://unctad.org/system/files/official-document/rmt2025ch2_en.pdf
UNCTADstat Shipbuilding Data Viewer
Context source for the public UNCTADstat shipbuilding data environment and related metric context. It is not used to add rows beyond the UNCTAD Table II.1 country list.
https://unctadstat.unctad.org/datacentre/dataviewer/US.ShipBuilding
UNCTAD Review of Maritime Transport Series
Context source for the annual maritime transport publication series covering fleet development, shipbuilding, orderbook and recycling trends.
https://unctad.org/topic/transport-and-trade-logistics/review-of-maritime-transport
Clarksons Research
Commercial maritime data provider cited by UNCTAD as the data basis for shipbuilding output, orderbook and fleet information. This page uses Clarksons figures only through UNCTAD’s published table.
