
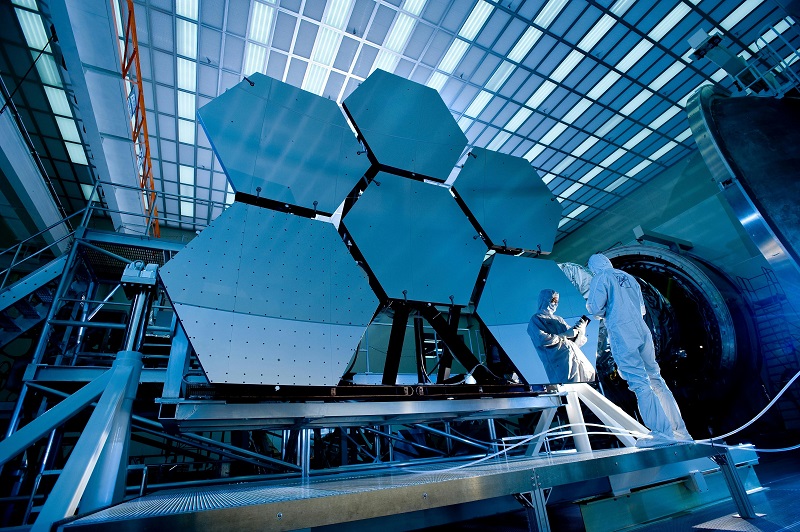
Top 100 Countries by Researchers in R&D per
Knowledge economy · Innovation · SDG 9.5.2 Where researcher density is deepest in the latest global data Researchers per million

Knowledge economy · Innovation · SDG 9.5.2 Where researcher density is deepest in the latest global data Researchers per million

Innovation · Economy · Country ranking Resident patent applications are one of the clearest country-level signals of domestic inventive activity
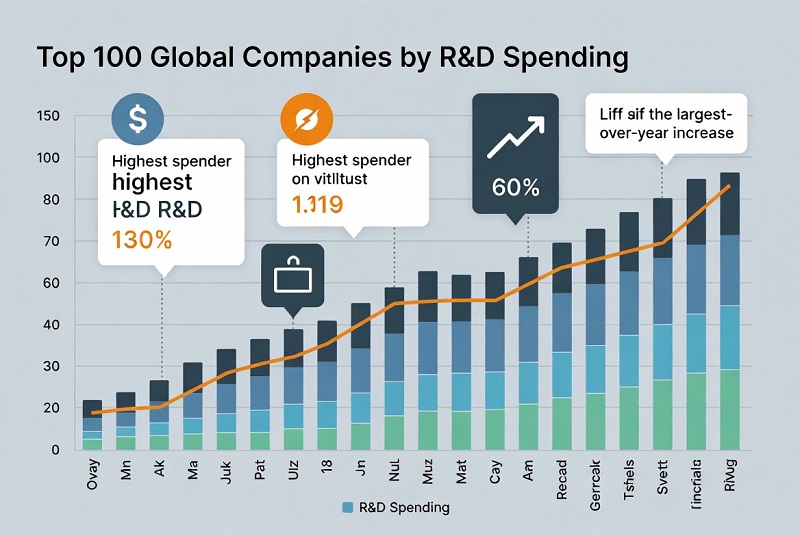
Corporate R&D investment: who spends the most (FY2024) This page ranks the largest corporate investors in research and development using
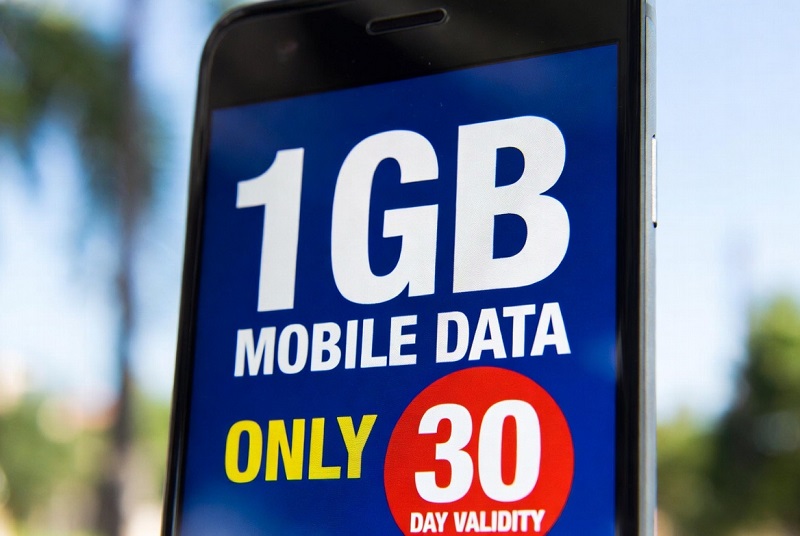
Digital, Innovation & Knowledge Economy Indicator: Mobile data cost Unit: USD per 1GB (standardized) Year: 2025 Coverage: 200+ economies (ranked

Telecom · Coverage · 2025 snapshot This ranking compares countries by the share of people living within the footprint of
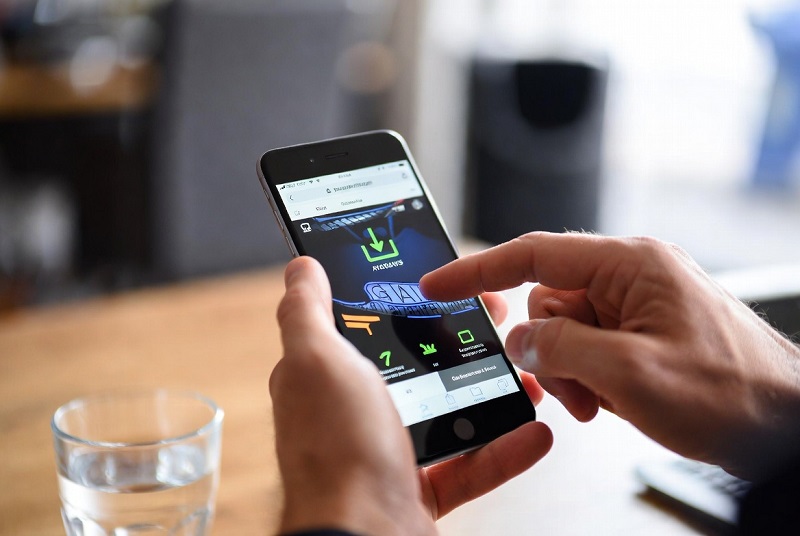
Digital Innovation · Connectivity · Mobile broadband This ranking compares median mobile download speeds (Mbps) across countries, using a 2025

StatRanker • Payments & Digital Economy • 2025 Beyond “cashless”: what a high digital-payments share actually signals in consumer markets

Startup Density in 2025: A Per-Capita View of Tech Ecosystems This ranking compares countries by tech startup density — the

StatRanker · Labour market structure · 2025 snapshot High-Skilled Employment as a “Knowledge Economy” Signal The high-skilled jobs share measures
R&D Intensity in 2025: Why “% of GDP” is the most comparable innovation gauge This ranking tracks R&D spending as

Fixed broadband Metric: median download speed (Mbps) Reference: 2025 release (country ranking) Beyond “advertised speeds”: what the median fixed broadband

StatRanker • Digital access statistics • 2025 edition Internet penetration rate (commonly reported as “Individuals using the Internet, % of
