

Top 100 Countries by Work-Life Balance, 2026
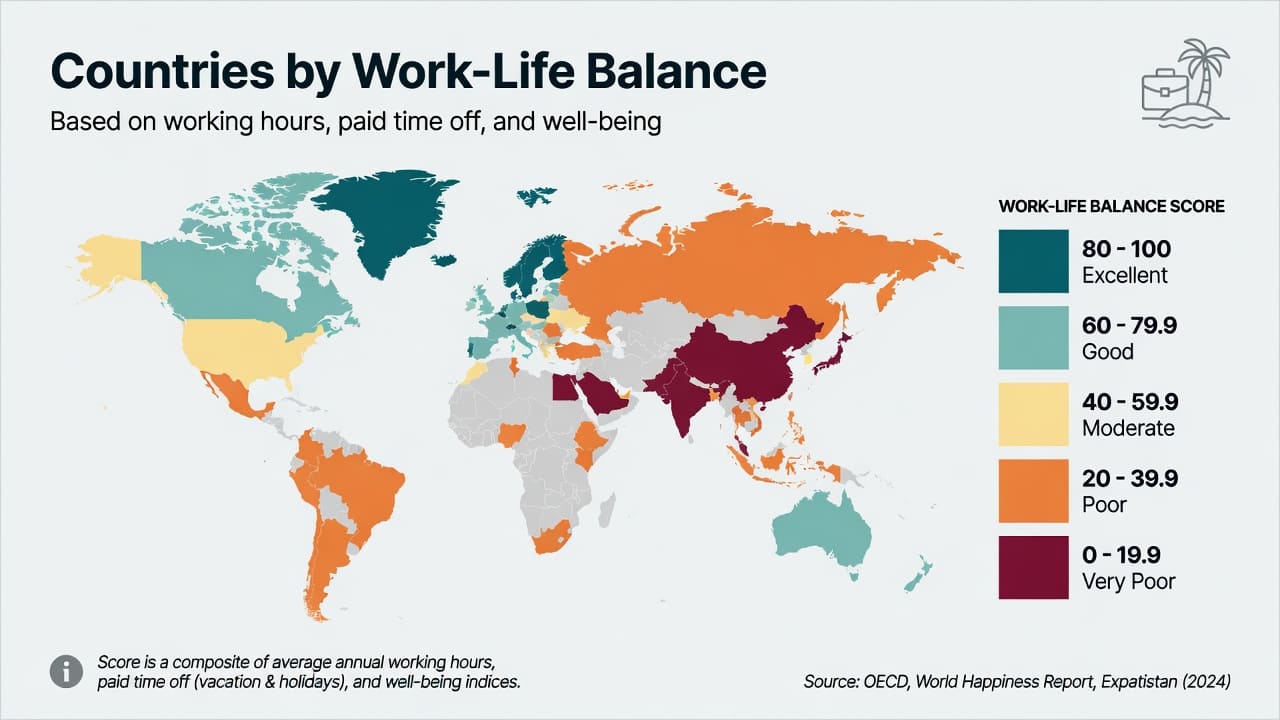
Work-Life Balance by Average Weekly Hours Worked
This ranking compares 100 countries using mean weekly hours actually worked per employed person. Lower values rank higher because they leave more time outside paid work, but the measure is only a working-time proxy and is not a complete index of work-life balance.
The table is a compiled research dataset based on four sources. Country values come from the ILO modelled-estimate indicator as reproduced in a 2026 country table, while ILO methodology and working-time publications are used to define the metric and its limits. Row-level source and method notes are shown in the ranking table.
Coverage: the 100 lowest values among 174 sovereign-country entries available in the accessible 2026 table. Unit: hours per employed person per week. Direction: ascending. Included rows: 100 official ILO modelled estimates, 0 external forecasts and 0 StatRanker projections.
Continue exploring
More StatRanker rankings on health systems, outcomes and medical capacity.
Most Peaceful Countries 2026: Global Peace Index Ranking
Open rankingTop 100 Countries by Cost of Housing vs Income, 2026
Open rankingTop 100 Countries by Rule of Law Index, 2025
Open rankingYemen ranks first on the narrow weekly-hours measure.
Saint Lucia is the highest-hours country within this selected Top 100.
The middle falls between Latvia at 34.99 and Lithuania at 35.35 hours.
Top 100 sovereign countries from 174 eligible entries; all values are ILO modelled estimates.
How the working-time ranking should be read
Mean weekly hours actually worked includes time spent working in the reference week and can reflect full-time, part-time and other employment arrangements. The ranking orders the values from low to high. It does not create a new score and does not combine wages, paid leave, commuting time, family policy, job security or subjective well-being.
The metric is useful for comparing how much paid-work time the average employed person records. It is less suitable for judging whether workers have chosen those hours, whether income is sufficient, or whether low hours result from underemployment. For that reason, the article uses “work-life balance” only in the limited sense of time available outside paid work.
The accessible source table contains 183 country and economy labels. Nine non-sovereign, territorial or separately listed economy entries were excluded: Macau, Hong Kong, Western Sahara, Taiwan, Puerto Rico, Guam, the United States Virgin Islands, French Polynesia and New Caledonia. The remaining 174 sovereign-country values were sorted ascending, and the first 100 are shown.
Top 10 countries with the shortest average workweeks
The first ten entries range from 22.95 to 29.30 hours per employed person per week. Several are affected by labour-market conditions that make a simple “best balance” interpretation unsafe.
Top 10 by mean weekly hours actually worked, lower is better for this time-only ranking
| Rank | Country | Hours | Source / note |
|---|---|---|---|
| 1 | Yemen | 22.95 h | Middle East & North Africa; official ILO modelled estimate; 2026 snapshot; lower value ranks higher. |
| 2 | Netherlands | 26.57 h | Europe & Central Asia; official ILO modelled estimate; 2026 snapshot; lower value ranks higher. |
| 3 | Norway | 26.58 h | Europe & Central Asia; official ILO modelled estimate; 2026 snapshot; lower value ranks higher. |
| 4 | Syria | 27.90 h | Middle East & North Africa; official ILO modelled estimate; 2026 snapshot; lower value ranks higher. |
| 5 | Vanuatu | 28.31 h | East Asia & Pacific; official ILO modelled estimate; 2026 snapshot; lower value ranks higher. |
| 6 | Denmark | 28.91 h | Europe & Central Asia; official ILO modelled estimate; 2026 snapshot; lower value ranks higher. |
| 7 | Finland | 29.10 h | Europe & Central Asia; official ILO modelled estimate; 2026 snapshot; lower value ranks higher. |
| 8 | Austria | 29.15 h | Europe & Central Asia; official ILO modelled estimate; 2026 snapshot; lower value ranks higher. |
| 9 | Sweden | 29.20 h | Europe & Central Asia; official ILO modelled estimate; 2026 snapshot; lower value ranks higher. |
| 10 | Rwanda | 29.30 h | Sub-Saharan Africa; official ILO modelled estimate; 2026 snapshot; lower value ranks higher. |
Ranks use the unrounded numeric values shown in the source reproduction. Equal values are ordered alphabetically.
Chart: Top 20 shortest average weekly hours
The chart uses the same values as the table. Shorter bars represent fewer average hours and therefore a higher position in this narrow ranking.
Methodology
Metric
Mean weekly hours actually worked per employed person, total sex. Unit: hours per employed person per week.
Direction
Ascending. A lower weekly-hours value receives a higher rank. Ties are ordered alphabetically.
Source status
Values are official ILO modelled estimates reproduced in the accessible 2026 country table. They are not calculations or projections made for this article.
Snapshot year
The accessible table labels the ILO column as 2026. The year is treated as the estimate snapshot, not as a claim about survey fieldwork dates.
Coverage rule
Sovereign-country labels were retained. Territories, dependencies and separately listed non-UN economies were excluded before ranking.
Missing values
Countries absent from the accessible table were not estimated or inserted. The Top 100 comes only from confirmed numeric rows.
Conflicts
No averaging across sources was performed. The ILO indicator is the primary metric; the reproduction is used to access the 2026 country values.
Rounding
Values are displayed to two decimal places. Ranking uses the same two-decimal values provided in the accessible table.
What the metric does not measure: paid annual leave, parental leave, legal maximum hours, overtime premiums, remote-work access, commute time, hourly pay, household care work, job quality, worker choice, productivity, life satisfaction or mental health.
Why low values require caution: average hours can fall because workers have secure short schedules, but they can also fall because of involuntary part-time work, weak demand, informality, conflict, seasonal employment or lower participation in intensive full-time jobs. The ranking should therefore be paired with employment, income and social-protection indicators.
Main ranking: Top 100 countries by weekly working-time balance
Search by country, filter by region or estimate type, change the sort order, or limit the visible ranking.
Showing 100 entries
Top 100 sovereign countries by mean weekly hours actually worked
| Rank | Country | Hours | Source / note |
|---|---|---|---|
| 1 | Yemen | 22.95 h | Middle East & North Africa; official ILO modelled estimate; 2026 snapshot; lower value ranks higher. |
| 2 | Netherlands | 26.57 h | Europe & Central Asia; official ILO modelled estimate; 2026 snapshot; lower value ranks higher. |
| 3 | Norway | 26.58 h | Europe & Central Asia; official ILO modelled estimate; 2026 snapshot; lower value ranks higher. |
| 4 | Syria | 27.90 h | Middle East & North Africa; official ILO modelled estimate; 2026 snapshot; lower value ranks higher. |
| 5 | Vanuatu | 28.31 h | East Asia & Pacific; official ILO modelled estimate; 2026 snapshot; lower value ranks higher. |
| 6 | Denmark | 28.91 h | Europe & Central Asia; official ILO modelled estimate; 2026 snapshot; lower value ranks higher. |
| 7 | Finland | 29.10 h | Europe & Central Asia; official ILO modelled estimate; 2026 snapshot; lower value ranks higher. |
| 8 | Austria | 29.15 h | Europe & Central Asia; official ILO modelled estimate; 2026 snapshot; lower value ranks higher. |
| 9 | Sweden | 29.20 h | Europe & Central Asia; official ILO modelled estimate; 2026 snapshot; lower value ranks higher. |
| 10 | Rwanda | 29.30 h | Sub-Saharan Africa; official ILO modelled estimate; 2026 snapshot; lower value ranks higher. |
| 11 | Germany | 29.66 h | Europe & Central Asia; official ILO modelled estimate; 2026 snapshot; lower value ranks higher. |
| 12 | Iraq | 30.34 h | Middle East & North Africa; official ILO modelled estimate; 2026 snapshot; lower value ranks higher. |
| 13 | Ireland | 30.45 h | Europe & Central Asia; official ILO modelled estimate; 2026 snapshot; lower value ranks higher. |
| 14 | Somalia | 30.50 h | Sub-Saharan Africa; official ILO modelled estimate; 2026 snapshot; lower value ranks higher. |
| 15 | Chad | 30.55 h | Sub-Saharan Africa; official ILO modelled estimate; 2026 snapshot; lower value ranks higher. |
| 16 | Djibouti | 30.75 h | Sub-Saharan Africa; official ILO modelled estimate; 2026 snapshot; lower value ranks higher. |
| 17 | Malawi | 30.76 h | Sub-Saharan Africa; official ILO modelled estimate; 2026 snapshot; lower value ranks higher. |
| 18 | Tonga | 30.77 h | East Asia & Pacific; official ILO modelled estimate; 2026 snapshot; lower value ranks higher. |
| 19 | France | 30.87 h | Europe & Central Asia; official ILO modelled estimate; 2026 snapshot; lower value ranks higher. |
| 20 | Ethiopia | 31.08 h | Sub-Saharan Africa; official ILO modelled estimate; 2026 snapshot; lower value ranks higher. |
| 21 | Japan | 31.10 h | East Asia & Pacific; official ILO modelled estimate; 2026 snapshot; lower value ranks higher. |
| 22 | United Kingdom | 31.17 h | Europe & Central Asia; official ILO modelled estimate; 2026 snapshot; lower value ranks higher. |
| 23 | Australia | 31.29 h | East Asia & Pacific; official ILO modelled estimate; 2026 snapshot; lower value ranks higher. |
| 24 | Belgium | 31.43 h | Europe & Central Asia; official ILO modelled estimate; 2026 snapshot; lower value ranks higher. |
| 25 | Estonia | 31.60 h | Europe & Central Asia; official ILO modelled estimate; 2026 snapshot; lower value ranks higher. |
| 26 | Canada | 31.86 h | North America; official ILO modelled estimate; 2026 snapshot; lower value ranks higher. |
| 27 | Spain | 31.95 h | Europe & Central Asia; official ILO modelled estimate; 2026 snapshot; lower value ranks higher. |
| 28 | Luxembourg | 32.14 h | Europe & Central Asia; official ILO modelled estimate; 2026 snapshot; lower value ranks higher. |
| 29 | Iceland | 32.37 h | Europe & Central Asia; official ILO modelled estimate; 2026 snapshot; lower value ranks higher. |
| 30 | Mozambique | 32.49 h | Sub-Saharan Africa; official ILO modelled estimate; 2026 snapshot; lower value ranks higher. |
| 31 | Ghana | 32.69 h | Sub-Saharan Africa; official ILO modelled estimate; 2026 snapshot; lower value ranks higher. |
| 32 | Slovenia | 33.30 h | Europe & Central Asia; official ILO modelled estimate; 2026 snapshot; lower value ranks higher. |
| 33 | Portugal | 33.46 h | Europe & Central Asia; official ILO modelled estimate; 2026 snapshot; lower value ranks higher. |
| 34 | New Zealand | 33.48 h | East Asia & Pacific; official ILO modelled estimate; 2026 snapshot; lower value ranks higher. |
| 35 | Timor-Leste | 33.59 h | East Asia & Pacific; official ILO modelled estimate; 2026 snapshot; lower value ranks higher. |
| 36 | Uruguay | 33.68 h | Latin America & Caribbean; official ILO modelled estimate; 2026 snapshot; lower value ranks higher. |
| 37 | Malta | 33.74 h | Europe & Central Asia; official ILO modelled estimate; 2026 snapshot; lower value ranks higher. |
| 38 | Croatia | 33.86 h | Europe & Central Asia; official ILO modelled estimate; 2026 snapshot; lower value ranks higher. |
| 39 | Slovakia | 33.88 h | Europe & Central Asia; official ILO modelled estimate; 2026 snapshot; lower value ranks higher. |
| 40 | Italy | 33.90 h | Europe & Central Asia; official ILO modelled estimate; 2026 snapshot; lower value ranks higher. |
| 41 | Barbados | 34.47 h | Latin America & Caribbean; official ILO modelled estimate; 2026 snapshot; lower value ranks higher. |
| 42 | Azerbaijan | 34.48 h | Europe & Central Asia; official ILO modelled estimate; 2026 snapshot; lower value ranks higher. |
| 43 | Czechia | 34.49 h | Europe & Central Asia; official ILO modelled estimate; 2026 snapshot; lower value ranks higher. |
| 44 | Switzerland | 34.61 h | Europe & Central Asia; official ILO modelled estimate; 2026 snapshot; lower value ranks higher. |
| 45 | Madagascar | 34.75 h | Sub-Saharan Africa; official ILO modelled estimate; 2026 snapshot; lower value ranks higher. |
| 46 | Hungary | 34.84 h | Europe & Central Asia; official ILO modelled estimate; 2026 snapshot; lower value ranks higher. |
| 47 | Solomon Islands | 34.94 h | East Asia & Pacific; official ILO modelled estimate; 2026 snapshot; lower value ranks higher. |
| 48 | Argentina | 34.95 h | Latin America & Caribbean; official ILO modelled estimate; 2026 snapshot; lower value ranks higher. |
| 49 | Israel | 34.96 h | Middle East & North Africa; official ILO modelled estimate; 2026 snapshot; lower value ranks higher. |
| 50 | Latvia | 34.99 h | Europe & Central Asia; official ILO modelled estimate; 2026 snapshot; lower value ranks higher. |
| 51 | Lithuania | 35.35 h | Europe & Central Asia; official ILO modelled estimate; 2026 snapshot; lower value ranks higher. |
| 52 | Cyprus | 35.41 h | Europe & Central Asia; official ILO modelled estimate; 2026 snapshot; lower value ranks higher. |
| 53 | Afghanistan | 35.60 h | South Asia; official ILO modelled estimate; 2026 snapshot; lower value ranks higher. |
| 54 | Nicaragua | 35.91 h | Latin America & Caribbean; official ILO modelled estimate; 2026 snapshot; lower value ranks higher. |
| 55 | Democratic Republic of the Congo | 35.92 h | Sub-Saharan Africa; official ILO modelled estimate; 2026 snapshot; lower value ranks higher. |
| 56 | Panama | 36.00 h | Latin America & Caribbean; official ILO modelled estimate; 2026 snapshot; lower value ranks higher. |
| 57 | Belarus | 36.02 h | Europe & Central Asia; official ILO modelled estimate; 2026 snapshot; lower value ranks higher. |
| 58 | United States | 36.27 h | North America; official ILO modelled estimate; 2026 snapshot; lower value ranks higher. |
| 59 | Poland | 36.31 h | Europe & Central Asia; official ILO modelled estimate; 2026 snapshot; lower value ranks higher. |
| 60 | Chile | 36.38 h | Latin America & Caribbean; official ILO modelled estimate; 2026 snapshot; lower value ranks higher. |
| 61 | Bahamas | 36.64 h | Latin America & Caribbean; official ILO modelled estimate; 2026 snapshot; lower value ranks higher. |
| 62 | Fiji | 37.14 h | East Asia & Pacific; official ILO modelled estimate; 2026 snapshot; lower value ranks higher. |
| 63 | Ecuador | 37.15 h | Latin America & Caribbean; official ILO modelled estimate; 2026 snapshot; lower value ranks higher. |
| 64 | North Macedonia | 37.19 h | Europe & Central Asia; official ILO modelled estimate; 2026 snapshot; lower value ranks higher. |
| 65 | Serbia | 37.22 h | Europe & Central Asia; official ILO modelled estimate; 2026 snapshot; lower value ranks higher. |
| 66 | South Korea | 37.29 h | East Asia & Pacific; official ILO modelled estimate; 2026 snapshot; lower value ranks higher. |
| 67 | Moldova | 37.36 h | Europe & Central Asia; official ILO modelled estimate; 2026 snapshot; lower value ranks higher. |
| 68 | Comoros | 37.42 h | Sub-Saharan Africa; official ILO modelled estimate; 2026 snapshot; lower value ranks higher. |
| 69 | Georgia | 37.53 h | Europe & Central Asia; official ILO modelled estimate; 2026 snapshot; lower value ranks higher. |
| 70 | Bulgaria | 37.60 h | Europe & Central Asia; official ILO modelled estimate; 2026 snapshot; lower value ranks higher. |
| 71 | Indonesia | 37.63 h | East Asia & Pacific; official ILO modelled estimate; 2026 snapshot; lower value ranks higher. |
| 72 | Gambia | 37.84 h | Sub-Saharan Africa; official ILO modelled estimate; 2026 snapshot; lower value ranks higher. |
| 73 | Togo | 37.87 h | Sub-Saharan Africa; official ILO modelled estimate; 2026 snapshot; lower value ranks higher. |
| 74 | Bolivia | 37.89 h | Latin America & Caribbean; official ILO modelled estimate; 2026 snapshot; lower value ranks higher. |
| 75 | Peru | 37.92 h | Latin America & Caribbean; official ILO modelled estimate; 2026 snapshot; lower value ranks higher. |
| 76 | Kazakhstan | 37.96 h | Europe & Central Asia; official ILO modelled estimate; 2026 snapshot; lower value ranks higher. |
| 77 | Brazil | 38.06 h | Latin America & Caribbean; official ILO modelled estimate; 2026 snapshot; lower value ranks higher. |
| 78 | Russia | 38.19 h | Europe & Central Asia; official ILO modelled estimate; 2026 snapshot; lower value ranks higher. |
| 79 | Venezuela | 38.19 h | Latin America & Caribbean; official ILO modelled estimate; 2026 snapshot; lower value ranks higher. |
| 80 | Greece | 38.26 h | Europe & Central Asia; official ILO modelled estimate; 2026 snapshot; lower value ranks higher. |
| 81 | Armenia | 38.28 h | Europe & Central Asia; official ILO modelled estimate; 2026 snapshot; lower value ranks higher. |
| 82 | Mauritius | 38.28 h | Sub-Saharan Africa; official ILO modelled estimate; 2026 snapshot; lower value ranks higher. |
| 83 | Trinidad and Tobago | 38.29 h | Latin America & Caribbean; official ILO modelled estimate; 2026 snapshot; lower value ranks higher. |
| 84 | Kyrgyzstan | 38.45 h | Europe & Central Asia; official ILO modelled estimate; 2026 snapshot; lower value ranks higher. |
| 85 | Romania | 38.48 h | Europe & Central Asia; official ILO modelled estimate; 2026 snapshot; lower value ranks higher. |
| 86 | Kenya | 38.88 h | Sub-Saharan Africa; official ILO modelled estimate; 2026 snapshot; lower value ranks higher. |
| 87 | Dominican Republic | 39.13 h | Latin America & Caribbean; official ILO modelled estimate; 2026 snapshot; lower value ranks higher. |
| 88 | Sri Lanka | 39.46 h | South Asia; official ILO modelled estimate; 2026 snapshot; lower value ranks higher. |
| 89 | Nigeria | 39.52 h | Sub-Saharan Africa; official ILO modelled estimate; 2026 snapshot; lower value ranks higher. |
| 90 | Mauritania | 39.53 h | Sub-Saharan Africa; official ILO modelled estimate; 2026 snapshot; lower value ranks higher. |
| 91 | Philippines | 39.76 h | East Asia & Pacific; official ILO modelled estimate; 2026 snapshot; lower value ranks higher. |
| 92 | Eritrea | 39.81 h | Sub-Saharan Africa; official ILO modelled estimate; 2026 snapshot; lower value ranks higher. |
| 93 | Central African Republic | 39.94 h | Sub-Saharan Africa; official ILO modelled estimate; 2026 snapshot; lower value ranks higher. |
| 94 | Niger | 39.97 h | Sub-Saharan Africa; official ILO modelled estimate; 2026 snapshot; lower value ranks higher. |
| 95 | Belize | 40.02 h | Latin America & Caribbean; official ILO modelled estimate; 2026 snapshot; lower value ranks higher. |
| 96 | Saint Vincent and the Grenadines | 40.04 h | Latin America & Caribbean; official ILO modelled estimate; 2026 snapshot; lower value ranks higher. |
| 97 | Tanzania | 40.05 h | Sub-Saharan Africa; official ILO modelled estimate; 2026 snapshot; lower value ranks higher. |
| 98 | Suriname | 40.13 h | Latin America & Caribbean; official ILO modelled estimate; 2026 snapshot; lower value ranks higher. |
| 99 | Bahrain | 40.17 h | Middle East & North Africa; official ILO modelled estimate; 2026 snapshot; lower value ranks higher. |
| 100 | Saint Lucia | 40.29 h | Latin America & Caribbean; official ILO modelled estimate; 2026 snapshot; lower value ranks higher. |
Source chain: ILOSTAT modelled estimates, with the 2026 country values accessed through the World Population Review reproduction. Data checked on July 12, 2026.
Insights from the weekly-hours distribution
Half of the Top 100 is below 35 hours
Rank 50 is Latvia at 34.99 hours, while rank 51 is Lithuania at 35.35. The median is 35.17 hours.
Europe dominates the selected group
Europe & Central Asia accounts for 41 of the 100 rows, reflecting widespread part-time work and shorter recorded averages in many European labour markets.
Low hours do not share one cause
The Top 20 mixes high-income European economies with countries affected by conflict, informality or limited labour demand. The same numeric outcome can therefore have very different meanings.
The displayed range spans 17.34 hours
Yemen at 22.95 hours and Saint Lucia at 40.29 hours define the Top 100 spread. That difference is more than two standard eight-hour workdays.
What the ranking means
A country near the top has a lower average number of hours actually worked by employed people. That may indicate more part-time employment, shorter standard schedules, stronger working-time protections or a labour market where workers spend less time in paid work.
The same position can also reflect underemployment, economic disruption or a large share of workers unable to obtain more hours. For policy or relocation decisions, this ranking should be combined with median earnings, employment rates, paid leave, childcare access, commuting time and life-satisfaction data.
The values are official ILO modelled estimates rather than raw survey observations copied directly from one national statistical office. Modelled estimates improve international coverage but still depend on available surveys, harmonisation choices and estimation methods.
FAQ
Which country ranks first in this 2026 table?
Yemen ranks first with 22.95 average weekly hours. This should not be interpreted as proof that Yemen has the world’s best overall work-life balance.
Why does the ranking use lower hours as better?
The selected metric measures time spent in paid work. Lower hours imply more time outside paid work, but the metric does not show whether the reduction is voluntary or financially sustainable.
Is this a composite work-life balance index?
No. It is a single-indicator ranking based on mean weekly hours actually worked per employed person.
Are the values official statistics?
They are ILO modelled estimates published through ILOSTAT and reproduced in the accessible 2026 country table. They are not projections created for this page.
Why are some wealthy countries below conflict-affected countries?
Average hours can be low for positive reasons such as shorter schedules, or negative reasons such as underemployment, disruption and weak labour demand. The metric cannot distinguish those causes by itself.
Why are only 100 countries shown?
The accessible table provided 174 eligible sovereign-country values after nine territories or separately listed economies were excluded. The 100 lowest values form this ranking.
Why are territories and separate economies excluded?
The article applies a sovereign-country rule so the comparison does not mix states with territories, dependencies and separately reported economies.
What other indicators should be checked?
Useful companion indicators include employment rate, involuntary part-time work, wages, paid leave, parental leave, commute time, social protection, job security and life satisfaction.
Sources
ILOSTAT indicator catalogue
Primary official source environment for the mean weekly hours actually worked indicator and ILO modelled-estimate database.
ILOSTAT working-time topic
Definitions, standards and supporting material for working-time statistics.
ILO: Working Time and Work-Life Balance Around the World
Conceptual source explaining how working hours and working-time arrangements relate to work-life balance.
https://www.ilo.org/publications/working-time-and-work-life-balance-around-world
World Population Review 2026 country table
Accessible reproduction used to extract the 2026 country values attributed to the ILO modelled-estimate indicator.
https://worldpopulationreview.com/country-rankings/most-overworked-countries
Related rankings
More StatRanker rankings on health systems, outcomes and medical capacity.
Most Peaceful Countries 2026: Global Peace Index Ranking
Open rankingTop 100 Countries by Cost of Housing vs Income, 2026
Open rankingTop 100 Countries by Rule of Law Index, 2025
Open rankingTop Countries by Home Ownership Rate (Latest Available Data)
Open ranking
StatRanker (Website)
administrator
